As we all kinda knew in advance, 2016 turns out to be a record warm year. If you read UKMO you get Provisional full-year figures for global average near-surface temperatures confirm that last year, 2016, was one of the warmest two years on record, nominally exceeding the record temperature of 2015 but that's because they don't handle the Arctic very well, and the Arctic was very warm this year. NOAA is a bit more forthright (or see Moyhu): With eight consecutive record warm months from January to August, the globally averaged temperature over land and ocean surfaces for 2016 was the highest since record keeping began in 1880, according to NOAA scientists. During the final month, the December combined global land and ocean average surface temperature departure from average was the third highest on record for any month in the 137-year record. If this was some kind of record-setting attempt we'd all be saying "Yeah Global Temperature!" But that's probably not a very sensible reaction. Aanyway, man+dog has posted that, is there anything else to say?
Sea ice is looking exciting. For the moment the most wow view is the global one:
This has lasted long enough now to be hard to see as a minor temporary blip and might almost be considered a bit worrying.
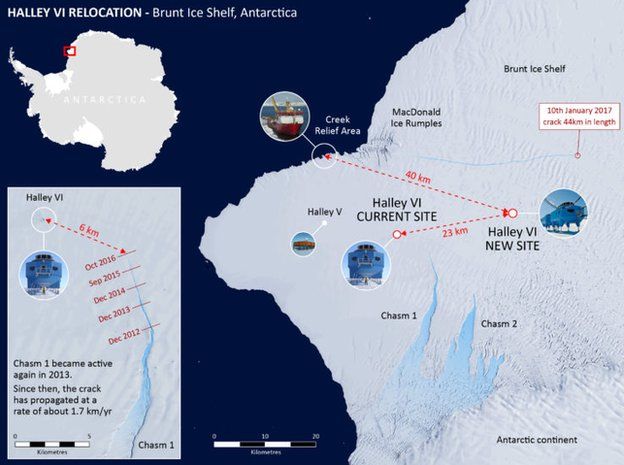
 In other news, Halley VI, having moved, is in some danger of having to move again due to yet another bloody crack in the Brunt Ice Shelf. Note: I think the blue line purporting to be the crack on the pic is just drawn on. There's some nice drone footage of said crack in the article. Having to shut down the base for the whole winter is a pain.
Meanwhile, just exactly in Cambridge, it is really quite cold: ducks standing on the ice weather. But we've been rewarded with some good sunrises and sunsets. The rosy fingers of dawn, as I put it to Miranda, who totally failed to recognise the Homeric allusions.
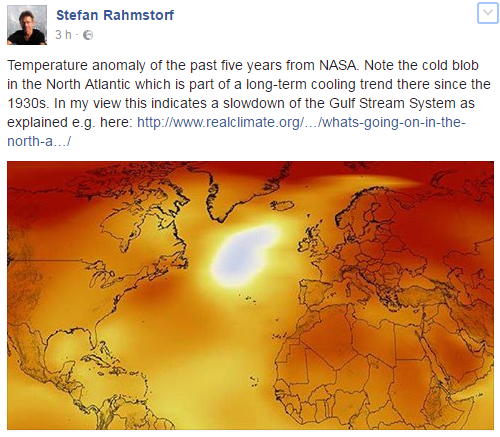
Update: scraped from via fb, from SR
It just struck me that he is probably right, that diagnosing the slowdown (not, of course, shutdown) from the temperature pattern is more useful than the rather flaky measurements. His link is: http://www.realclimate.org/index.php/archives/2015/03/whats-going-on-in….
Refs
* 2016 Temperature Records - RC by Gavin.
- Log in to post comments


Perhaps the tiny grabbing fingers of The Don are more [in]famous currently?
Not very cold up northwest today, these arctic excursions seem to be rather erratic this year.
Disconcerting they've had to shut down Halley VI, the fact it was made moveable indicates that problems were expected, but the rushed abandonment suggests unanticipated acceleration.
[The new crack is excitingly new, and not at all in the area previously being monitored. I do wonder if it isn't all a bit panic-stricken and they might change their minds later, though that might be a bit embarrassing -W]
I cannot see the first picture (on two different browsers).
[That's odd. The pic is http://archive.is/PvEeD/ce41a76d8ec3adbbae11ec2cc6804911d1155325.png, which is simply an archive of https://14adebb0-a-62cb3a1a-s-sites.googlegroups.com/site/arctischeping… That last, admittedly, goes via a download but the archive should be fine. The site is https://sites.google.com/site/arctischepinguin/home/global-sea-ice -W]
Muller/Berkeley Earth chimes in (in case you don't get their email bulletins):
2016: The Warmest Year on Record, with a Dip in the Second Half of the Year
-----excerpt follows----
2016 was the warmest year since humans began keeping records, by a wide margin. Global average temperatures were extremely hot in the first few months of the year, pushed up by a large El Nino event. Global surface temperatures dropped in the second half of 2016, yet still show a continuation of global warming. The global warming “pause”, which Berkeley Earth had always stressed was not statistically significant, now appears clearly to have been a temporary fluctuation.
Robert Rohde, Lead Scientist with Berkeley Earth, said “The record temperature in 2016 appears to come from a strong El Nino imposed on top of a long-term global warming trend that continues unabated."
============
Dunno where to find that online, it's their email bulletin.
Try this
http://berkeleyearth.org/?p=2162
or sign up with them
http://berkeleyearth.org/?p=2162
Blub to Lennox Island
https://www.theguardian.com/world/2017/jan/18/canada-island-climate-cha…
Known for its unusual red sand beaches.
It is somewhat annoying that, having patiently explained to people why the Antarctic sea ice is increasing, it goes and starts to shrink..
[Yees. its almost like the explanations are made up post-fact to explain whatever is seen -W]
How permanent this is remains to be seen... Halley VII should probably be a hovercraft.
[HVI was mega-expensive because it was designed to last for ages, and be movable. But of course the moves are mega-expensive too. A better strategy would have been a much cheaper base designed to last only 5 years before a rebuild elsewhere -W]
Might be an interesting melting season up north.
I think the Beeb wins Caption of the Day: "Broadly speaking, "north" is towards the top-left of this graphic"
For the moment the most wow view is the global one
I'd say the monthly Antarctic time series are pretty wow. The November one even more so. An immediate effect is that trends previously considered significant are no longer.
Yees. its almost like the explanations are made up post-fact to explain whatever is seen
Well, I've been touting natural variability for a while, citing SST records and evidence of large losses immediately preceding the satellite-era, so I'm claiming victory. To be fair, I think the explanation that gained most ground in the science world was "wind", which is a more precise sciency way of saying "natural variability" (though some suggested it could be a dynamic response to anthropogenic forcing of some sort). If the winds change, so will the ice. The Antarctic land ice loss idea has been popular on the webosphere, and that's going to take a big hit.
[There's some stuff around Southern Annual Mode and sea ice response (http://journals.ametsoc.org/doi/full/10.1175/JCLI3843.1) and then connections between SAM and ozone loss -W]
>But that’s probably not a very sensible reaction.
So is 28 of the 30 warmest years per GISS occur in the last 30 years and all 30 in the last 36 years slightly less 'not very sensible'?
Now I can see the first pic. No idea what was wrong.
However, now I do not see the above facebook update on two computers.
[Hmm, yes, worked from home for me this morning but not now at work. I've replaced it with a screen-grab -W]
Was not logged in to the evil digital empire, but doing that also does not help. I am "friend", maybe some security issues. No prob, just wanted to let you know.
Can see the cold blob now, and I'm not a friend..
It's not just the cold blob, but also the hot spot to the southwest, off the coast of New England/Atlantic Canada. The latter is the warm water that should be flowing into where that cold blob is. Since I live in coastal New England, that's having a more direct effect on me--the way this winter is going, I probably won't be putting the cross-country skis on at all this winter, and I've only been snowshoeing once (in conditions that could be generously described as marginal) this season. The long-range forecast is that we'll be much warmer than normal for the rest of January.
We're getting into scary territory with the Arctic sea ice coverage. Will there be any in late August? I don't know enough about the subject to take either side of that bet in 2017, but we know it will happen eventually.
What's the over/under on Antarctic sea ice going "ice free" at minimum before the Arctic?
[Interesting thought, which I don't think I've seen anyone thinking before. But, Antarctic sea ice is boring, remember? Mind you, now it is decreasing it may become more interesting :-) -W]
Anyone come across an animation showing age of ice for antarctica? Similar to this
https://www.youtube.com/watch?v=VIxciS1B9eo
Speaking of rapid meltdowns, The White House website Climate Page has already been taken down, and replaced with this:
https://vvattsupwiththat.blogspot.com/2017/01/that-didnt-take-long.html
Presidential spokesmarmot, Rainus Probeus, has indicated that the new administration will be focusing on the use of the newly uncovered and nearly limitless supply of sadistic impulse energy to move the country into first place in the stable of Russian satellites. “Amerika first, then the world!” chirped the wee spokesmarmot, as the President gripped his mighty pen in his tiny hand and began the dismantling of the world's last best hope. The Tillerson Putin Prosperity Sphere is expected to immediately begin pumping more carbon into the atmosphere than had previously been though possible by a technologically intelligent civilization. “Who would have thunk it? “ tweeted cousin Vladimir.
Who indeed.
There is no worse varmint than a marmot in lemming's clothing:
https://vvattsupwiththat.blogspot.com/2017/01/science-advisors-seen-mig…
"The temperature difference between 850 mb and 1000 mb has changed from about -2K to +1K (the near-surface is now warmer than 850 mb)." [for average of Nov, Dec, and Jan in Arctic]
'Temperature inversion gone' might be overstating this somewhat given it is a 3 month average. Nevertheless should we expect consequences of more convection and other effects of this. Are there better papers to look at than
https://www.researchgate.net/publication/232796146_Arctic_winter_warmin…
Is rising air when there isn't an inversion causing more cloud formation and precipitation adequately taken into account by that paper or out of the paper's scope?
Any thoughts on whether we should expect any changes?