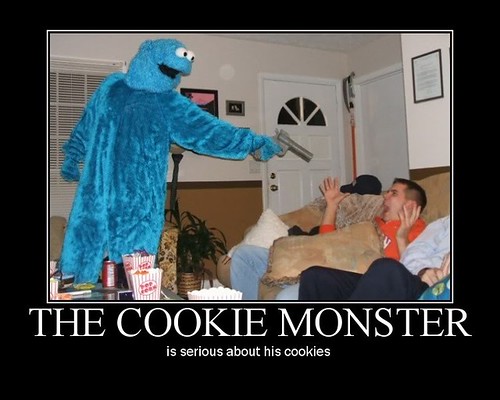
This is what children with poor self-control become
(from here)
Melody Dye at Child's Play has an interesting post about the famous (or infamous) cookie experiments, which involved observing children presented with a cookie and then left alone in a room. If they wait long enough, they get another cookie (and they know this). If not, then clearly they are doomed to fail in life:
Twenty years later, having spent long hours forgetting those misplaced moments, a new crop of experimental psychologists will add insult to injury, and call you, and ask pointed questions about your education, your personal life, and your current salary. "Of course I'm a failure..." you admit.
Years later still, there will be articles in high brow magazines and well considered newspapers that proclaim that the outcome of that experiment - the "delay of gratification" experiment, they're calling it - can predict your entire life. The test, they're saying, is a test of self control, and the longer you waited, the better your SAT scores, the better your attention span, the better your relationships, the better your sex life, and so on...
Your mother calls. "We always knew," she says. "You couldn't wait!" she says.
Well, that explains it. Your inglorious fate was predestined by an unfortunate biological glitch -
Or was it?
So I checked out the review Melody cited (pdf), and I'm not so certain. Here's what the reviewers concluded (italics mine, p. 936):
To obtain a more objective measure of cognitive academic competences and school-related achievements in adolescence, we also included Scholastic Aptitude Test (SAT) scores....both their verbal and quantitative SAT were significantly related to seconds of preschool delay time [how long before the cookie GOT EATED!]. The linear regression slope predicting SAT verbal scores from seconds of preschool delay time was 0.10 with a standard deviation of 0.04; for predicting SAT quantitative scores, the slope was 0.13 with a standard error of 0.03. The correlations were 0.42 for SAT verbal scores and 0.57 for SAT quantitative scores....The significant correlations between preschool delay time and adolescent outcomes, spanning more than a decade, were relatively large compared to the typically low or negligible associations found when single measures of social behavior are used to predict other behaviors, especially over a long developmental period. On the other hand, although the obtained significant associations are at a level that rivals many found between performances on intelligence tests repeated over this age span, most of the variance still remains unexplained. The small size of the SAT sample dictates special caution in these comparisons and underlines the need for replications, especially with other populations and at different ages.
Unfortunately, the actual data are in papers and book chapters that are 25-30 years old, so I can't actually find them. But correlations of 0.42 and 0.57 make me nervous without seeing the raw data. These aren't lab experiments, so I don't expect strong correlations (e.g., 0.9), but it's possible these are spurious correlations.
One way this can happen is that you have a big cloud of data, but there are a few outliers that force a line with a slope--this is particularly common when there is little data. If you remove these outliers, the slope vanishes. The other way is when a fair amount of the data have no correlative structure at all. Graphically, there are a bunch of points that run up and down the vertical axis right near the zero mark on the horizontal axis (e.g., all of the really impulsive kids, who covered the gamut of SAT scores), and a bunch of points that spread from left to right across the horizontal axis around the zero horizontal axis mark (e.g., kids with poor SAT scores range widely in their impulsiveness). Oddly enough, these two sets of utterly uncorrelated data actually 'anchor' the regression and make it possible to have a significant correlation; in my experience, these correlations can be as high as 0.5.
But even if we spot them the relationship, we're talking about, by the authors' own admission, a weak relationship to SAT scores, which is a weak predictor of successful outcomes later on in life. A weak predictor of a weak predictor isn't something to get too worked up about in terms of outcomes. That doesn't mean the experiment can't tell us something about childhood cognition, but it's a stretch to long term outcomes.
So, if you've stuck with the post this far, I hereby declare you are entitled to a cookie.
- Log in to post comments

Thanks. Mmmmmm. Oreo.
One wonders how hungry the kids were!
Make mine oatmeal-cranberry. :)