One of the discussants in Brain and Behavioral Sciences of Seth Roberts's article on self-experimentation was by Martin Voracek and Maryanne Fisher. They had a bunch of negative things to say about self-experimentation, but as a statistician, I was struck by their concern about "the overuse of the loess procedure." I think lowess (or loess) is just wonderful, and I don't know that I've ever seen it overused.
Curious, I looked up "Martin Voracek" on the web and found an article about body measurements from the British Medical Journal. The title of the article promised "trend analysis" and I was wondering what statistical methods they used--something more sophisticated than lowess, perhaps?
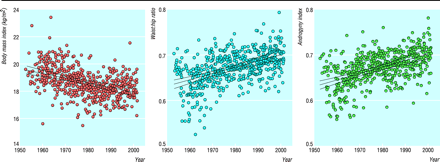
They did have one figure, and here it is:

Voracek and Fisher, the critics of lowess, are fit straight lines to data to clearly nonlinear data! It's most obvious in their leftmost graph. Voracek and Fisher get full credit for showing scatterplots, but hey . . . they should try lowess next time! What's really funny in the graph are the little dotted lines indicating inferential uncertainty in the regression lines--all under the assumption of linearity, of course. (You can see enlarged versions of their graphs at this link.)
As usual, my own house has some glass-based construction and so it's probably not so wise of me to throw stones, but really! Not knowing about lowess is one thing, but knowing about it, then fitting a straight line to nonlinear data, then criticizing someone else for doing it right--that's a bit much.
Not just lowess
Just to be clear, when I say "lowess is great," I really mean "smoothing regression is great"--lowess, also splines, generalized additive models, and all the other things that Cleveland, Hastie, Tibshirani, etc., have developed. (One of the current challenges in Bayesian data analysis is to integrate such methods. Maybe David Dunson will figure it all out.)
- Log in to post comments
Splines have been done, of course: Dave Lunn has a BUGS add-on, and this covers GAMs as well. I think there's another paper about using GAMs in BUGS that fixes the bases.
Come to think of it, some of Simon Wood's development of GAMs in his book is Bayesian.
Bob: Yes, I agree that models are there, at least since the 1970s when Grace Wahba set up spline models. But these methods are not yet fully integrated into the rest of statistical practice, for example with hierarchical models. I think it's possible to put this all together but I don't think it's been done yet in a way to enter routine practice.
i "heart" loess too! nice to know that it's not statistical junk food ;-)